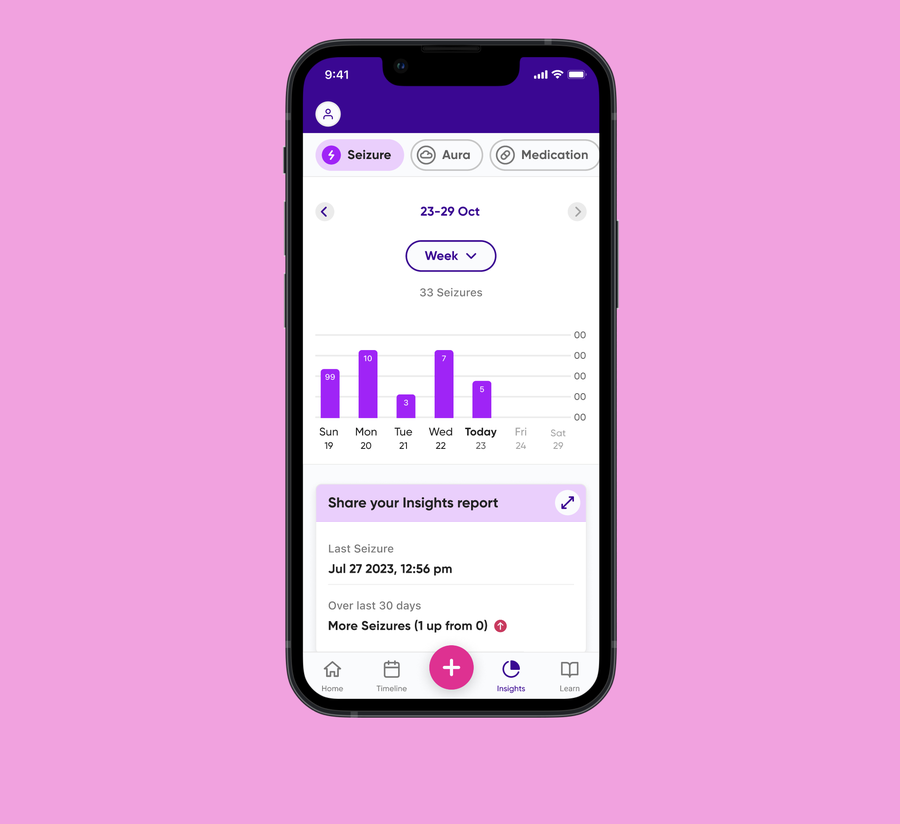
Product redesign · iOS & Android
Epsy, Insights 3.0
Team

The audit
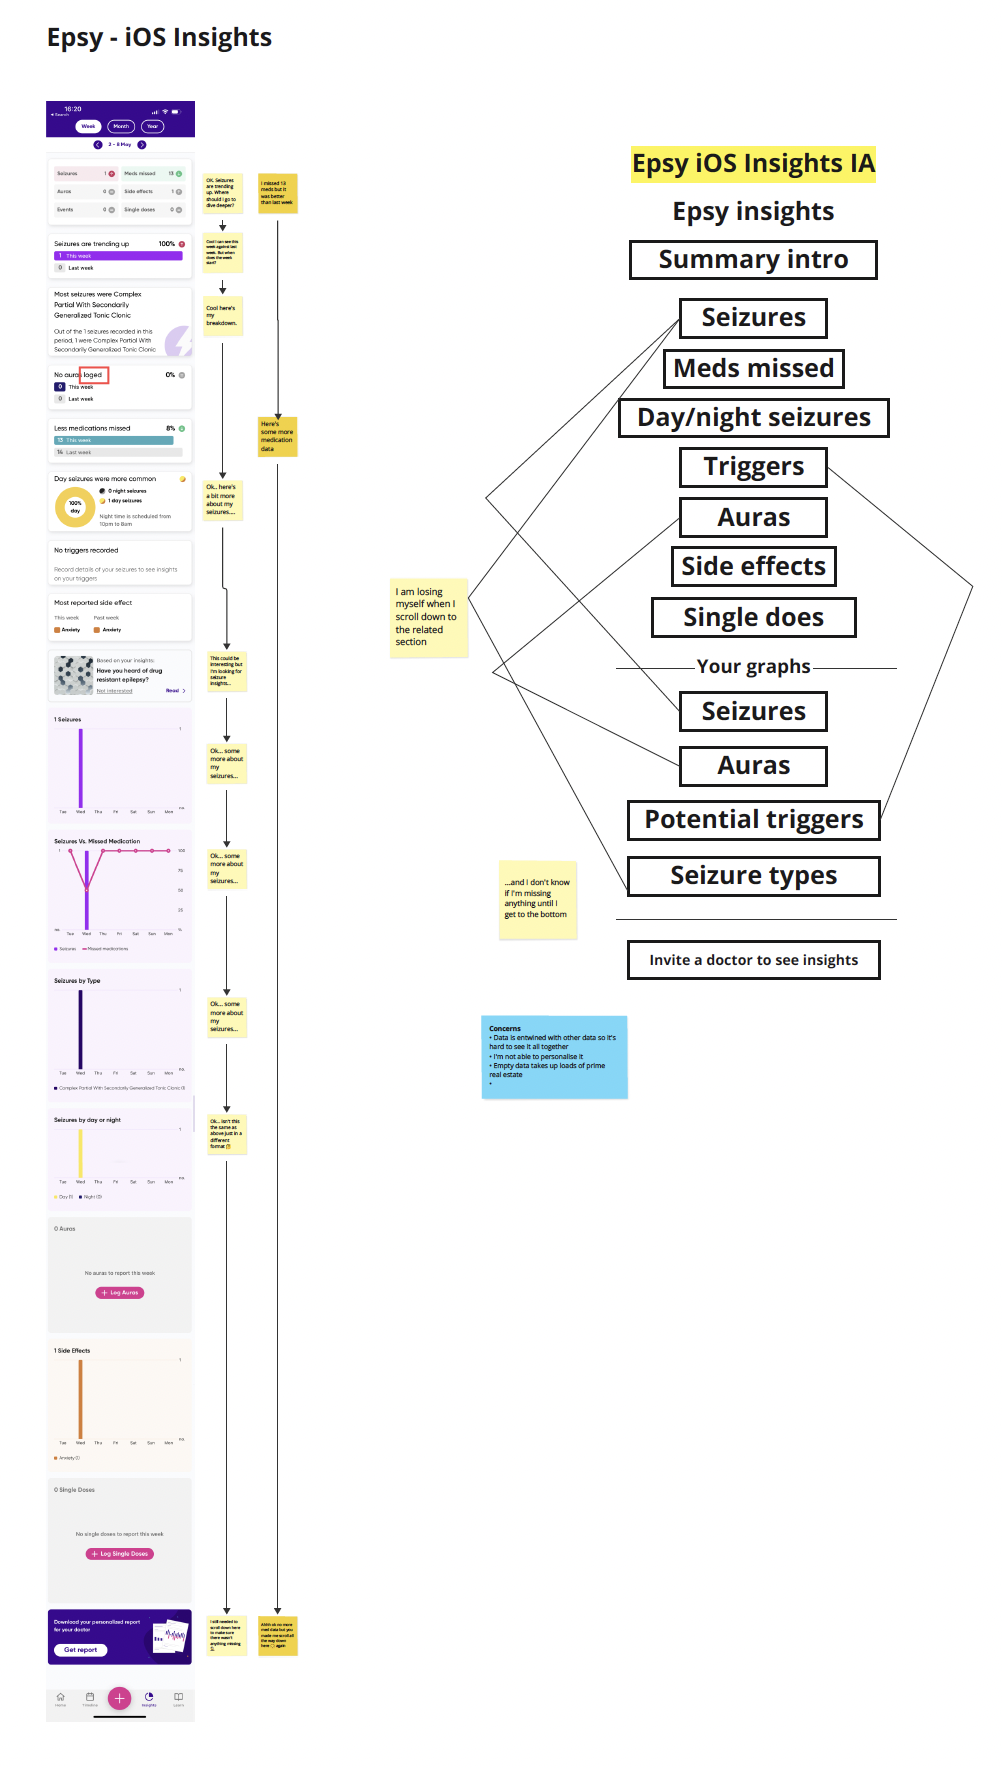
I tore down the existing iOS and Android apps against real complaints from patients and the support team: the IA was hard to mentally map, data was accurate but revealed no useful patterns, empty states didn't encourage logging, and there was no way to share any of it with a doctor.
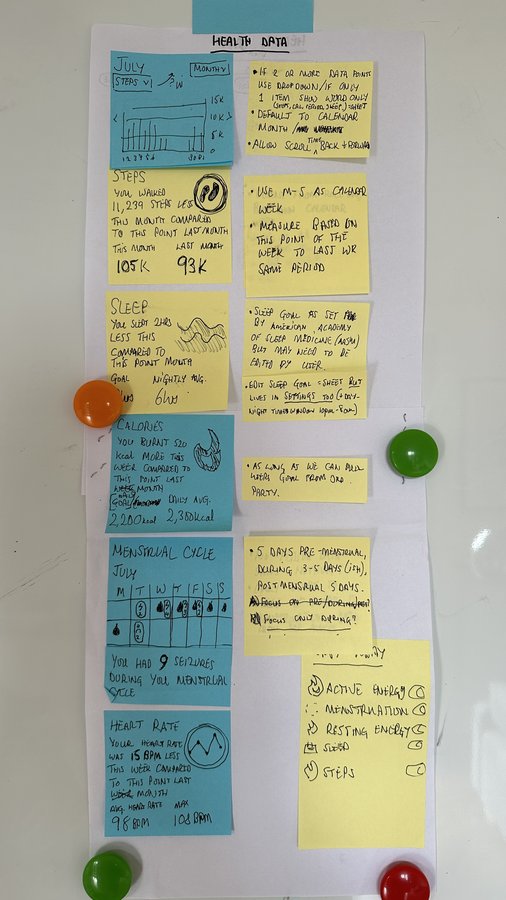
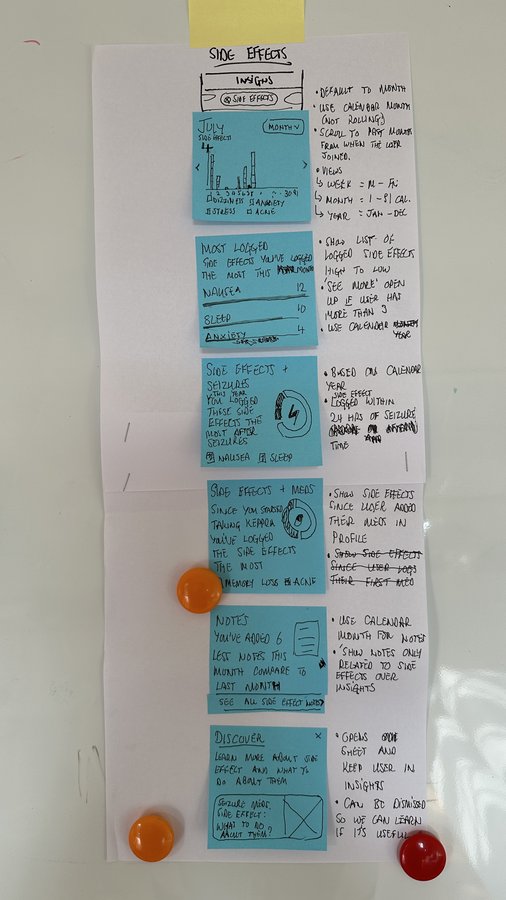
Paper prototyping every module
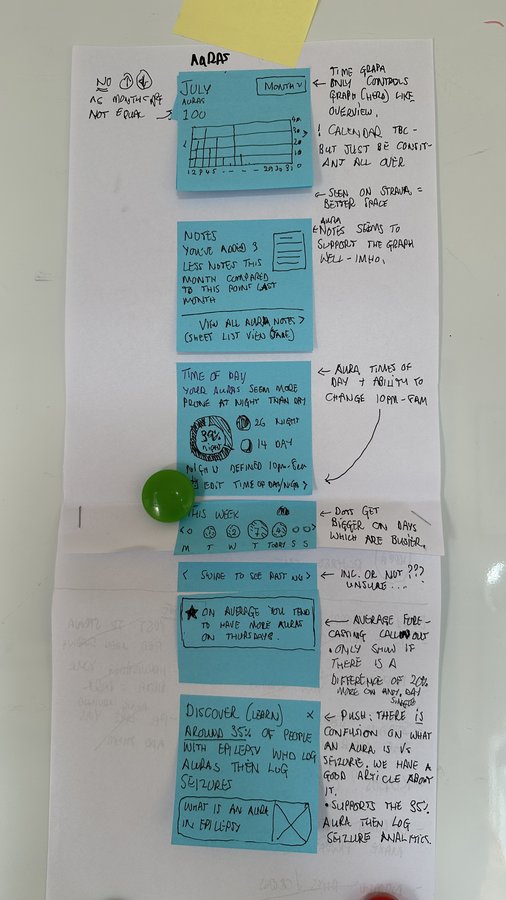
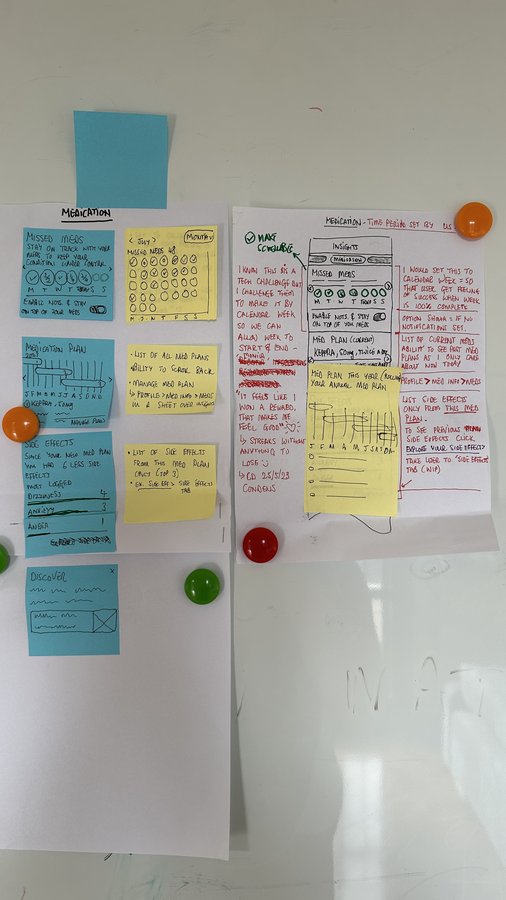
With the new IA agreed, I paper-prototyped each area: Health Data, Side Effects, Auras and Medication. Each one was annotated with empty states, calendar logic and what should surface first, before a screen was built in Figma.
Choosing what matters
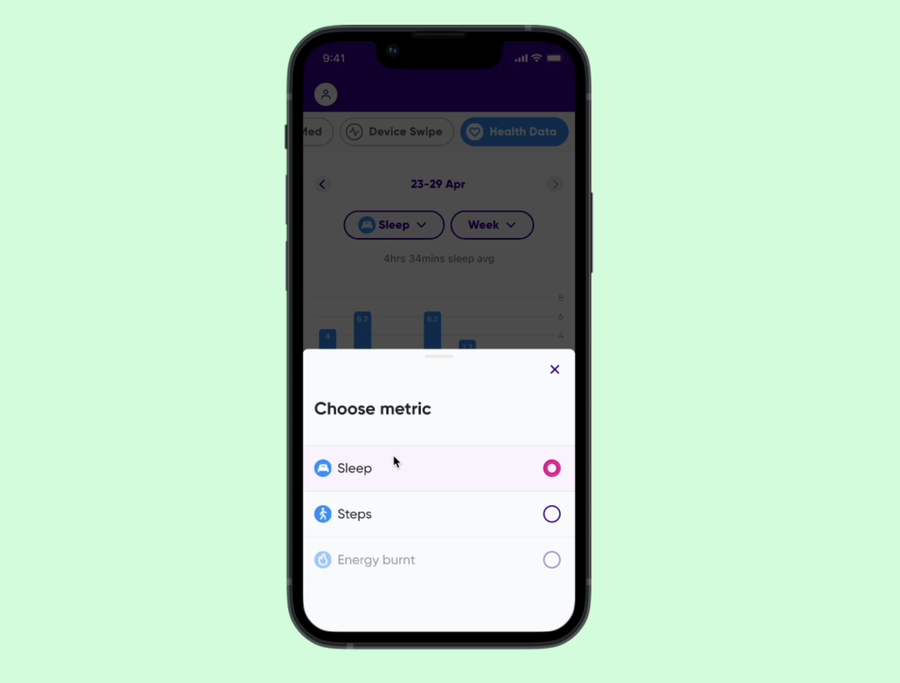
A simple metric picker keeps each screen focused on one comparison at a time, rather than showing every data point at once.
7-day retention
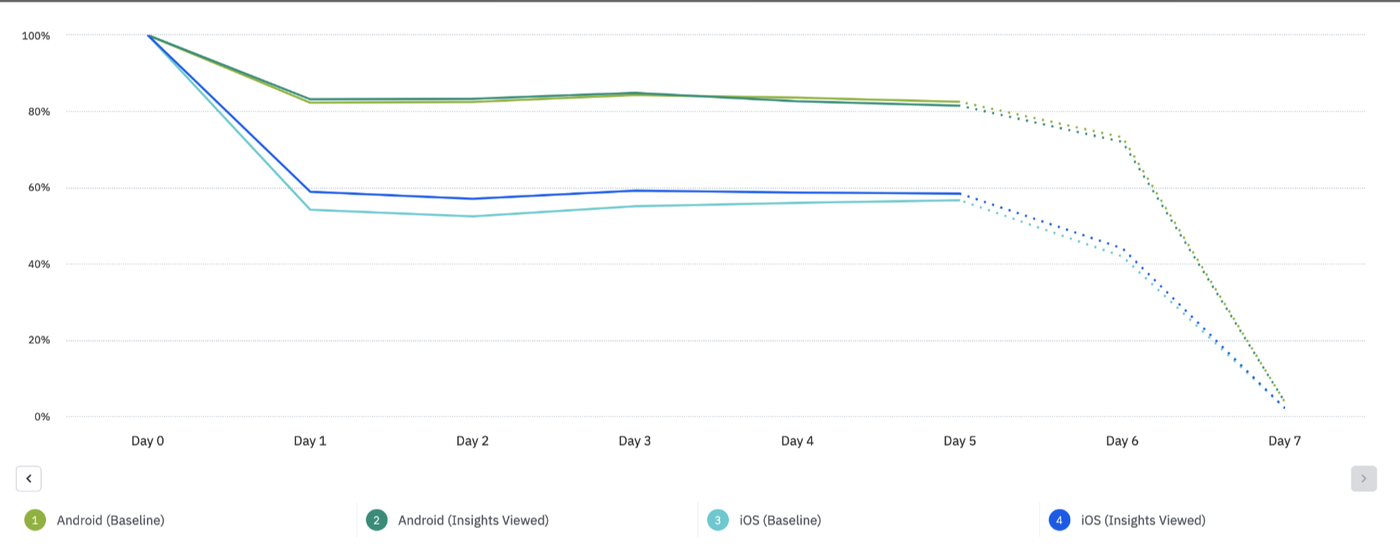
Early impact is minimal on both platforms. That's expected: Insights is a long-term feature, and its value builds gradually rather than overnight.
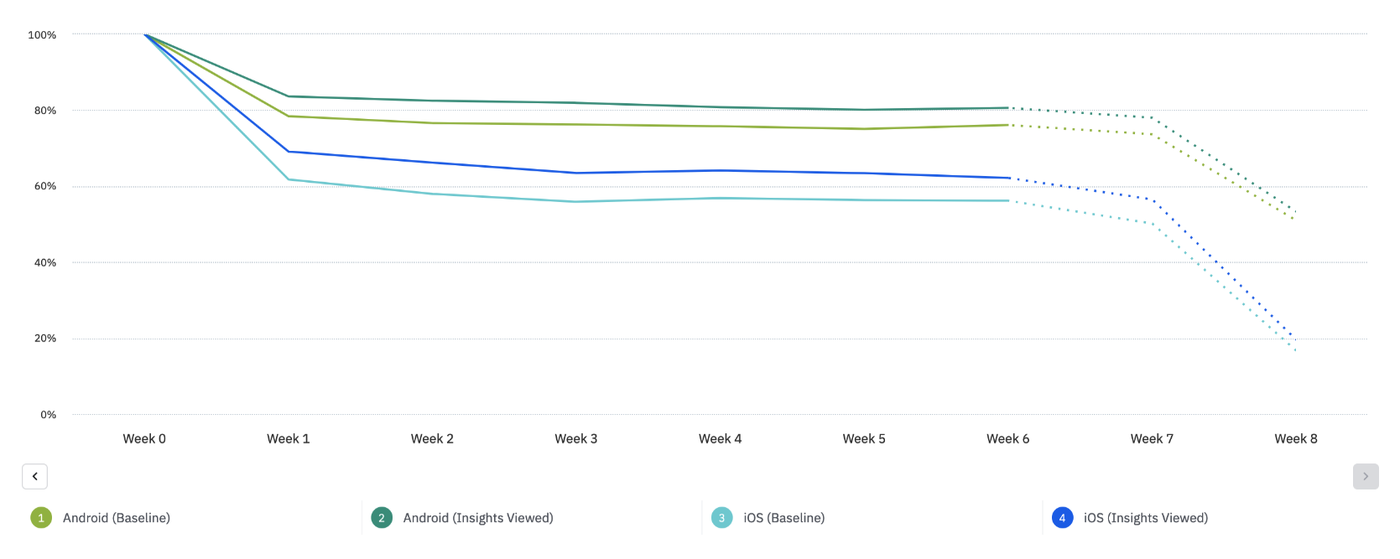
8-week retention
For users who'd seen Insights at least once, 8-week retention increased on Android from 75% to 80%, and on iOS from 55% to 62%.
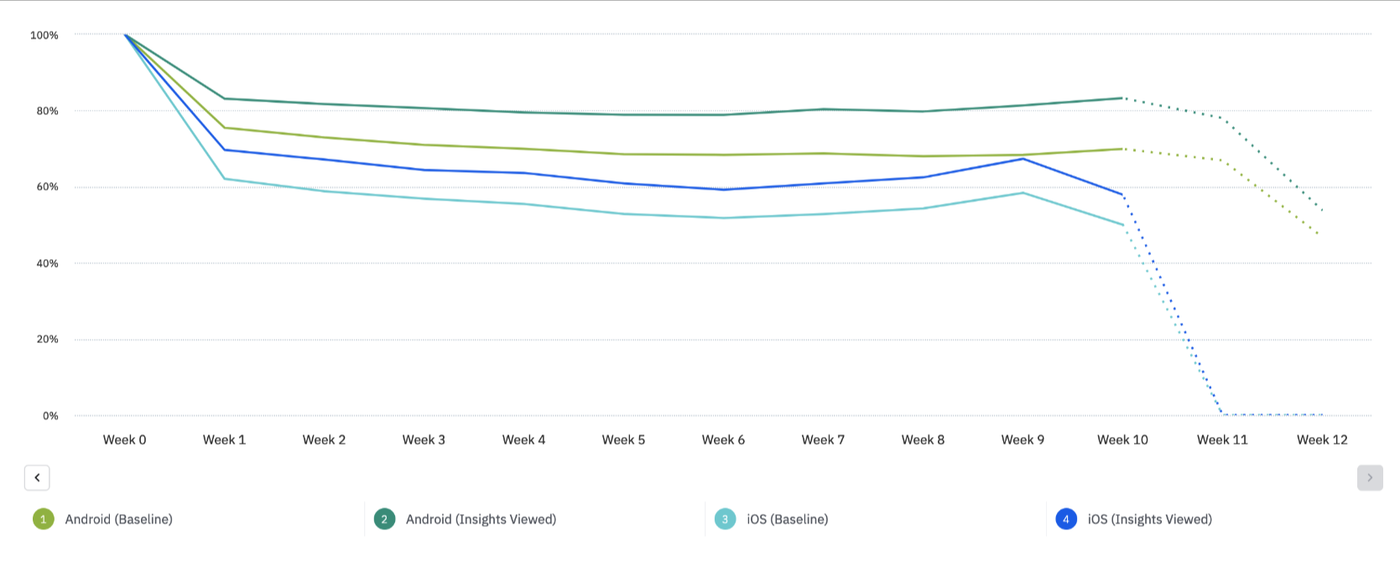
12-week retention
The uplift grows the longer you look: 12-week retention increased on Android from 70% to 83%, and on iOS from 58% to 67%.
Shared beyond the app
1,433 personalised PDF reports were shared with doctors, and 5,398 were viewed in-app. Insights became something that travelled beyond the phone.